Welcome to AIRPACT
Air-quality forecasting for the Pacific Northwest
The goal of the AIRPACT (Air Indicator Report for Public Awareness and Community Tracking) project is to provide timely air quality forecasts for the Pacific Northwest.
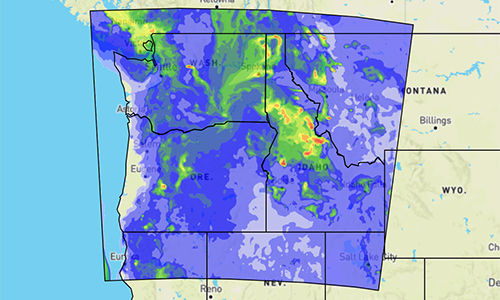
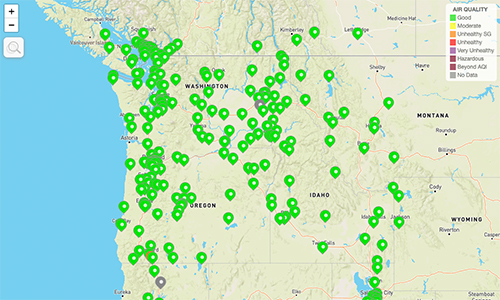
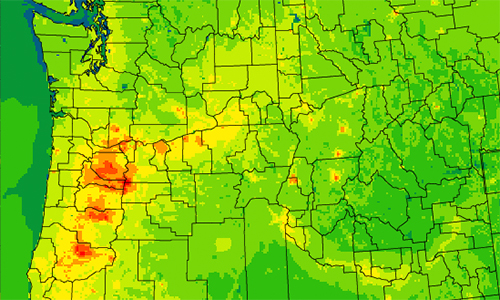
Air Quality Forecast Map
Species concentrations, emissions, meteorology
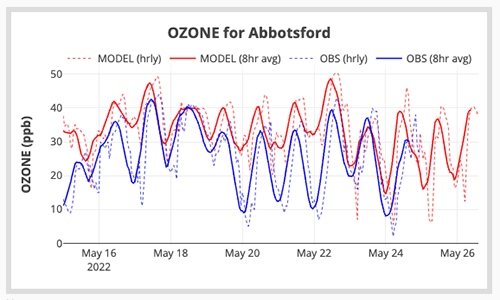
Performance Charts
Compare AIRPACT forecast to AIRNow observations

Monthly Statistics
Compare AIRPACT forecast to AIRNow observations
Kalman Filter
Bias-corrected PM2.5
Monthly Deposition
Dry and wet monthly deposition of Nitrogen and Sulfur
Boundary Conditions
Vertical curtain plots for the north, south, east, and west boundaries of AIRPACT for OZONE, PM2.5 and CO
Monthly Emissions
Monthly emissions summaries with search filters for date, sector, state/province, and county/region
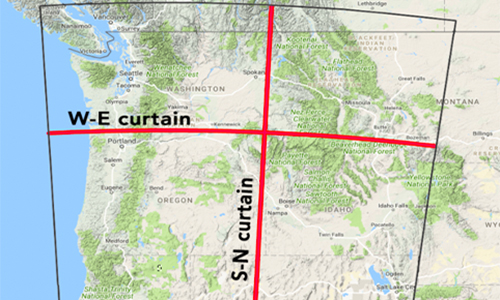
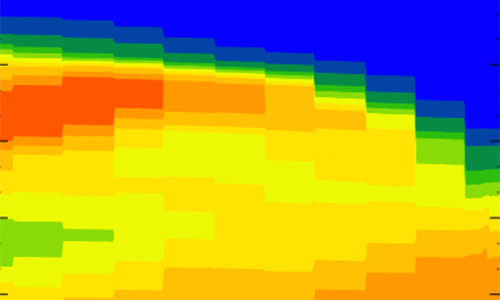
Curtain Plots
Animated north-south and east-west AIRPACT curtain plots of CO, Ozone, and PM2.5